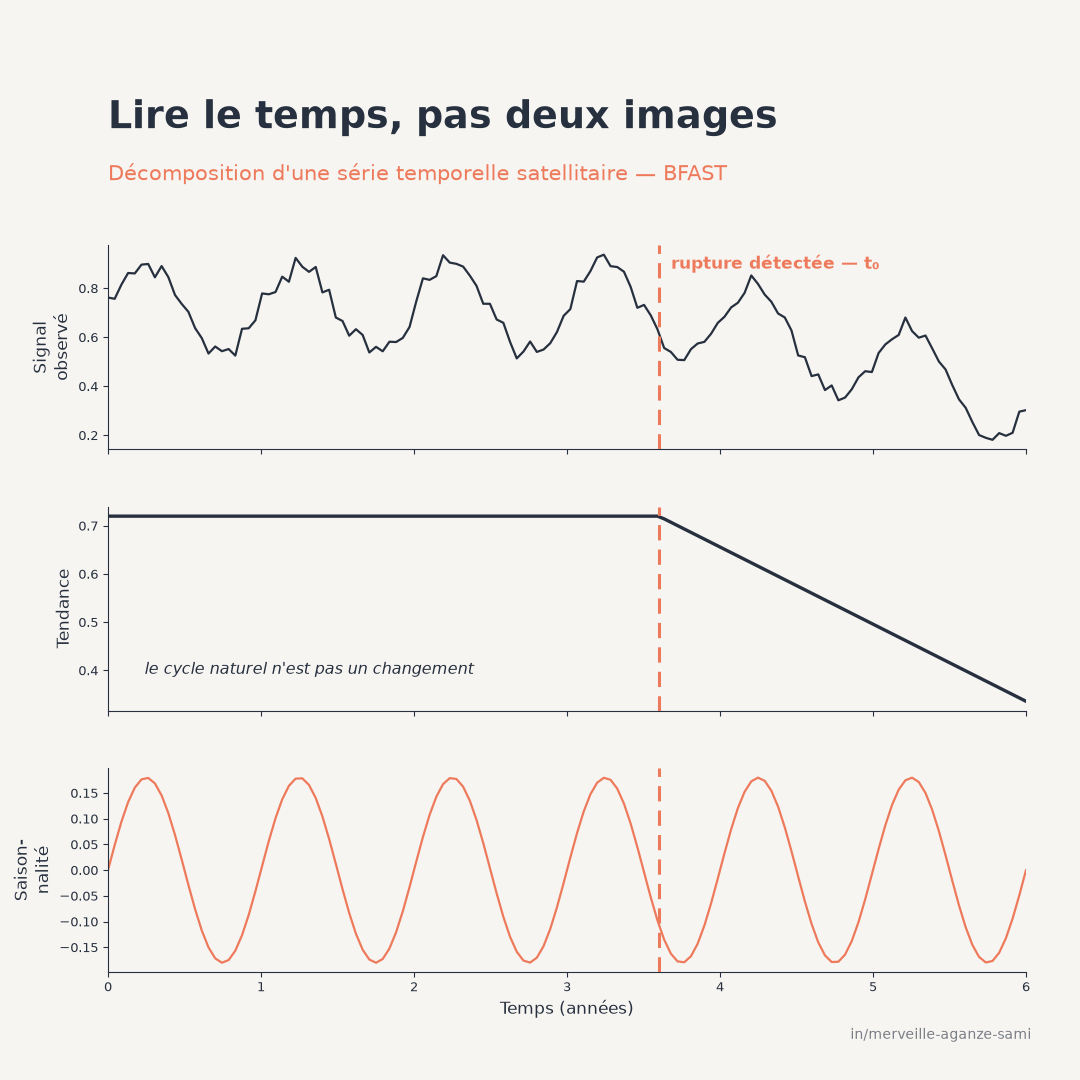
Open satellite archives now provide several observations per month over the same plot, with decades of historical depth. This density of information contrasts with common environmental monitoring practice, which often rests on comparing two images — a baseline situation and a current one.
This two-date comparison has two symmetrical weaknesses. It may flag change where there is only a difference in phenology or acquisition conditions. And it may miss gradual degradation whose amplitude between two dates stays below ordinary seasonal variability. In both cases, information about when the change occurred is lost.
1. Reading the series rather than two snapshots
The approach treats each pixel as a time series in its own right and separates its components: a trend, a seasonal cycle and a remainder. This decomposition, presented in the article on seasonal decomposition, is the prerequisite. Break detection then applies to the isolated components rather than to the raw signal (Verbesselt et al., 2010a).
The statistical framework used is that of structural change detection in a regression model: identifying the points at which the model parameters cease to be stable, and estimating their position and the associated uncertainty (Bai & Perron, 2003).
Two kinds of break. A break in the trend component reflects a change in level or slope — clearing, wood extraction, conversion to cropland. A break in the seasonal component reflects a change in the cycle itself — a shift in the growing period, an altered water regime. These two signals do not carry the same ecological meaning and deserve to be distinguished when reporting (Verbesselt et al., 2010b).
2. Parameters to decide
- 1Seasonal frequency. Number of observations per annual cycle. It must match the actual structure of acquisitions after masking, not the sensor's theoretical revisit rate.
- 2Minimum segment length. This parameter sets the duration below which a variation is not treated as a break. It directly trades sensitivity against robustness: a low value detects more breaks, an increasing share of which are false positives.
- 3Maximum number of breaks. This bounds model complexity. A high value allows a succession of events to be tracked; in return it increases the risk of segmenting noise.
- 4Order of the seasonal term. This determines how finely the cycle is modelled. Too high an order absorbs part of the change signal into the seasonal component.
3. The continuous monitoring variant
A distinct formulation addresses a different operational need: detecting a break as it happens rather than retrospectively. It rests on defining a historical period judged stable, on which a model is fitted, then monitoring new observations: when these depart durably from what the model predicts, an alert is issued (Verbesselt et al., 2012).
This approach turns monitoring into an alert system. It imposes a demanding condition, however: the historical period must genuinely be free of breaks. Degradation already under way within the history will be absorbed into the reference model and never flagged.
4. Reducing false alerts
- Interannual climate variability. A particularly dry season produces a departure from the model that is not degradation. Comparing a pixel's behaviour with that of its immediate neighbourhood, rather than with its own history alone, appreciably reduces this type of false positive (Hamunyela et al., 2016).
- Observation gaps. Prolonged cloud cover reduces the number of available observations and delays detection. The number of valid observations per pixel should be mapped alongside the results.
- Sensor change. An unharmonised instrumental transition will be read as a break, on an identical date across the whole territory — a recognisable signature that should prompt a review of pre-processing.
- Sample-based validation. A break map must be validated on an independent reference sample, with omission and commission rates estimated. Without this step, neither the affected area nor the average date is interpretable.
- A detected break is not an identified cause. The method dates a change in the signal's behaviour; it does not indicate its cause. Attribution to a specific activity is a separate verification, on very-high-resolution imagery or in the field.
5. What the method adds to monitoring
The main contribution is dating. Knowing when a shift occurred allows it to be related to documented events — the arrival of an operator, the opening of a track, a climatic episode, a regulatory change — and therefore to formulate testable attribution hypotheses. A change map without dates does not allow this.
The second contribution concerns magnitude, which distinguishes partial degradation from complete conversion. Combined with the date, it produces an indicator usable over time: area affected per period, with a level of impact, rather than a bare statement of difference between two years.
Key points
- Comparing two dates conflates seasonal variation with structural change
- The break is estimated on the decomposed components, not on the raw signal
- Minimum segment length and maximum number of breaks trade sensitivity against robustness
- The monitoring variant assumes a genuinely stable historical period
- A break map must be validated on an independent sample before any decision use
The value of a satellite archive lies not in the number of images it holds, but in the ability to exploit the temporal continuity linking them. It is that continuity which allows a change to be dated rather than merely noted.
References
- Bai, J., & Perron, P. (2003). Computation and analysis of multiple structural change models. Journal of Applied Econometrics, 18(1), 1–22. doi.org/10.1002/jae.659
- Hamunyela, E., Verbesselt, J., & Herold, M. (2016). Using spatial context to improve early detection of deforestation from Landsat time series. Remote Sensing of Environment, 172, 126–138. doi.org/10.1016/j.rse.2015.11.006
- Verbesselt, J., Hyndman, R., Newnham, G., & Culvenor, D. (2010a). Detecting trend and seasonal changes in satellite image time series. Remote Sensing of Environment, 114(1), 106–115. doi.org/10.1016/j.rse.2009.08.014
- Verbesselt, J., Hyndman, R., Zeileis, A., & Culvenor, D. (2010b). Phenological change detection while accounting for abrupt and gradual trends in satellite image time series. Remote Sensing of Environment, 114(12), 2970–2980. doi.org/10.1016/j.rse.2010.08.003
- Verbesselt, J., Zeileis, A., & Herold, M. (2012). Near real-time disturbance detection using satellite image time series. Remote Sensing of Environment, 123, 98–108. doi.org/10.1016/j.rse.2012.02.022

Merveille Aganze Sami
MEL & Database Management Advisor. 9+ years of experience in monitoring & evaluation, GIS and digitalization with international organizations (GIZ, Enabel) in DR Congo.
Degradation monitoring to equip?
Get in touch