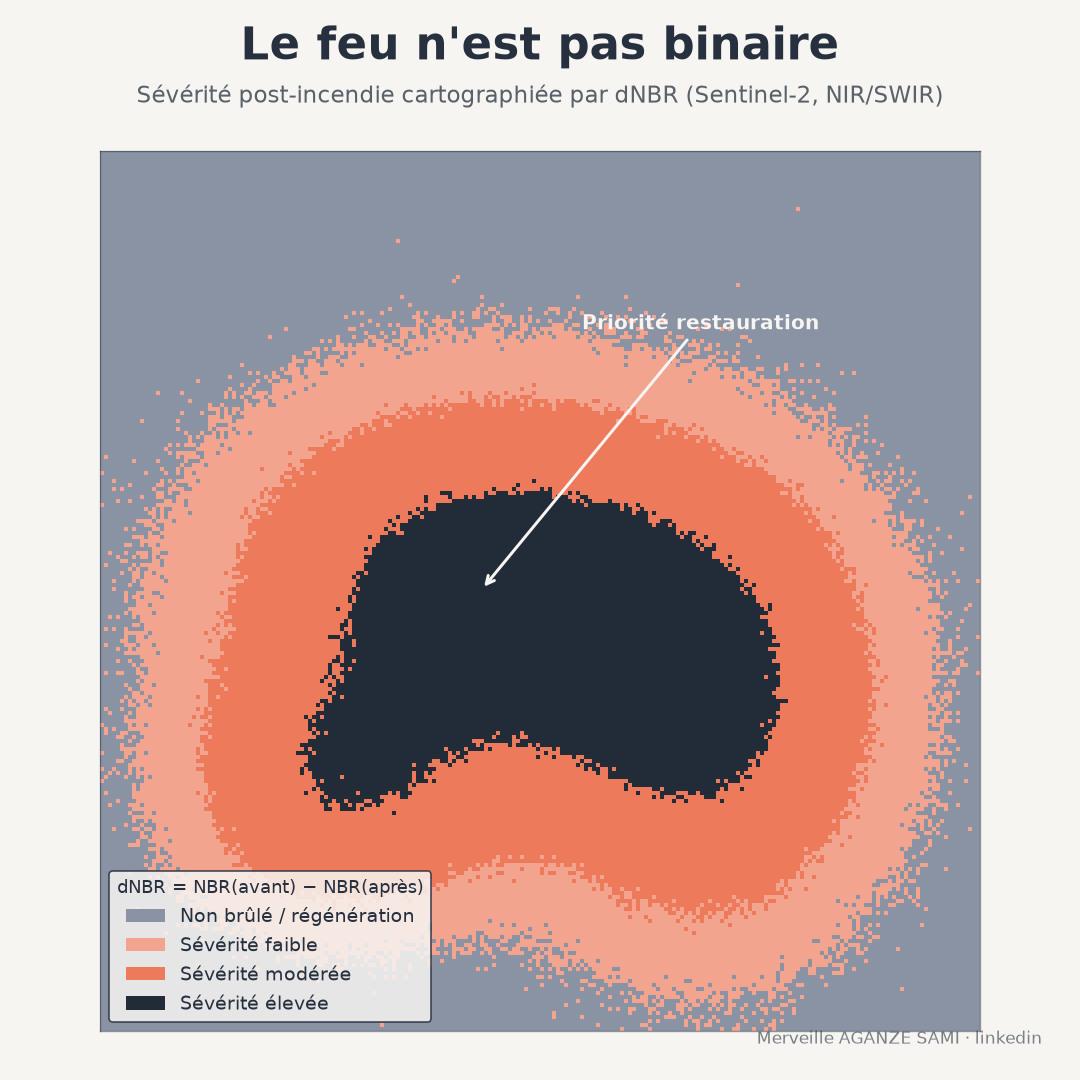
After a fire has passed, delineating the burn perimeter is useful but partial information. It shows where the fire went, without distinguishing sectors where vegetation cover was destroyed from those where it was only partly affected. Yet these two situations call for neither the same ecological diagnosis nor the same restoration measures.
Direct observation runs into material constraints: the areas concerned often extend over hundreds of square kilometres, in poorly accessible forest-savanna mosaics. Remote sensing provides a spatially exhaustive, reproducible and documented measurement. It deserves all the more attention as satellite inventories place Africa foremost in burned area worldwide, and as moderate-resolution products appreciably underestimate that total, a substantial share of small fires escaping a 500-metre resolution (Ramo et al., 2021).
1. The spectral basis of the NBR index
The Normalized Burn Ratio exploits the opposing behaviour of two spectral domains under combustion. In the near infrared, reflectance is high for dense chlorophyll-bearing vegetation and drops when leaf structure is destroyed. In the shortwave infrared, reflectance instead increases as water content falls and bare soil, ash and char appear.
The normalised combination of these two bands therefore maximises the contrast between a vegetated and a burned surface. On Sentinel-2 it uses bands B8A and B12; on Landsat 8/9, bands 5 and 7. The formulation and its operational classes were established in the post-fire assessment protocol of the FIREMON programme (Key & Benson, 2006).
2. From NBR to dNBR
The difference principle. dNBR is computed as the difference between pre-fire and post-fire NBR, conventionally multiplied by 1000 to work with integers. It measures not a state but a change: it is the magnitude of the spectral shift, not the absolute post-fire value, that informs on the intensity of impact on the canopy.
This difference produces a continuous gradient, discretised into classes — unburned, low, moderate and high severity — whose indicative bounds, drawn from North American literature, must be adjusted to context. A wooded savanna and a dense forest do not exhibit the same amplitudes of change.
3. Correcting for pre-fire cover: RdNBR and RBR
dNBR has a structural limitation: its amplitude depends on the biomass present before the fire. A dense formation may lose a great deal in absolute value while retaining part of its cover, whereas a sparse formation, entirely destroyed, shows a smaller change. Comparing these two situations on dNBR alone overstates severity in the better-stocked environments.
The Relative differenced NBR addresses this bias by scaling dNBR to the initial state, through the square root of pre-fire NBR. This normalisation improves comparability across cover types within a single heterogeneous landscape (Miller & Thode, 2007). A later formulation, the Relativized Burn Ratio, modifies the denominator to limit the instability observed when pre-fire NBR approaches zero, and generally shows a closer correspondence with field measurements (Parks et al., 2014).
4. Implementation caveats
- Choice of dates. An initial assessment, on imagery acquired shortly after the fire is out, measures the direct effect of combustion. An extended assessment, in the following growing season, incorporates delayed mortality and regrowth capacity. The two windows answer distinct questions and are not interchangeable; the one retained must be stated.
- Phenological effect. If the pre and post images belong to different seasons, the measured change aggregates the fire effect and the seasonal dynamics of the canopy. Using dates from the same period, or a seasonal composite, limits this confounding.
- Clouds, smoke and shadows. Quality masks must be applied strictly. Unmasked residual smoke alters reflectance in both domains and produces severity values with no physical basis.
- Geometric registration. As the computation is pixel-by-pixel, an offset between the two dates generates artefacts along field boundaries and forest edges. Co-registration quality must be checked before any processing.
- Ambiguous signal in sparsely vegetated settings. NBR responds to structure and water content; over bare soils, outcrops or already degraded areas, the relationship between index change and actual severity weakens appreciably (Roy et al., 2006).
5. Calibration and validation
Class thresholds should not be carried over unchanged from one publication to another. The recommended approach is to calibrate the bounds locally from field observations — Composite Burn Index plots, geolocated photographs, transects — then document the resulting relationship between index value and observed severity. This calibration is the main guarantee of a severity map's transferability.
Where field access is not possible, partial validation remains feasible by comparison with very-high-resolution imagery or with accounts from neighbouring communities, provided the associated confidence level is stated explicitly.
6. Operational use
A properly produced severity map supports three direct uses: prioritising restoration work, concentrating resources on high-severity sectors where natural regeneration is least likely; quantifying ecological impact, by intersection with land-cover and biodiversity layers; and building a documented archive of the event, reusable for multi-year monitoring of recovery.
This last point deserves attention. Comparing several events over time presupposes that the method, the time windows and the thresholds remain identical. A written and versioned protocol conditions the value of the resulting series.
Key points
- NBR combines near and shortwave infrared to maximise contrast after combustion
- dNBR measures a change between two dates, not a post-fire state
- RdNBR and RBR correct the dependence on pre-fire cover and improve comparability
- Time window, phenology, masking and co-registration condition the validity of the result
- Class thresholds must be calibrated locally and the protocol versioned
A fire does not have a binary effect on vegetation cover. It is the severity gradient, not the burn perimeter alone, that provides the information needed for a restoration decision.
References
- Key, C. H., & Benson, N. C. (2006). Landscape Assessment (LA): Sampling and Analysis Methods. In FIREMON: Fire Effects Monitoring and Inventory System (RMRS-GTR-164-CD). Fort Collins: USDA Forest Service, Rocky Mountain Research Station.
- Miller, J. D., & Thode, A. E. (2007). Quantifying burn severity in a heterogeneous landscape with a relative version of the delta Normalized Burn Ratio (dNBR). Remote Sensing of Environment, 109(1), 66–80. doi.org/10.1016/j.rse.2006.12.006
- Parks, S. A., Dillon, G. K., & Miller, C. (2014). A New Metric for Quantifying Burn Severity: The Relativized Burn Ratio. Remote Sensing, 6(3), 1827–1844. doi.org/10.3390/rs6031827
- Ramo, R., Roteta, E., Bistinas, I., van Wees, D., Bastarrika, A., Chuvieco, E., & van der Werf, G. R. (2021). African burned area and fire carbon emissions are strongly impacted by small fires undetected by coarse resolution satellite data. PNAS, 118(9), e2011160118. doi.org/10.1073/pnas.2011160118
- Roy, D. P., Boschetti, L., & Trigg, S. N. (2006). Remote Sensing of Fire Severity: Assessing the Performance of the Normalized Burn Ratio. IEEE Geoscience and Remote Sensing Letters, 3(1), 112–116. doi.org/10.1109/LGRS.2005.858485

Merveille Aganze Sami
MEL & Database Management Advisor. 9+ years of experience in monitoring & evaluation, GIS and digitalization with international organizations (GIZ, Enabel) in DR Congo.
Post-fire monitoring to set up?
Get in touch