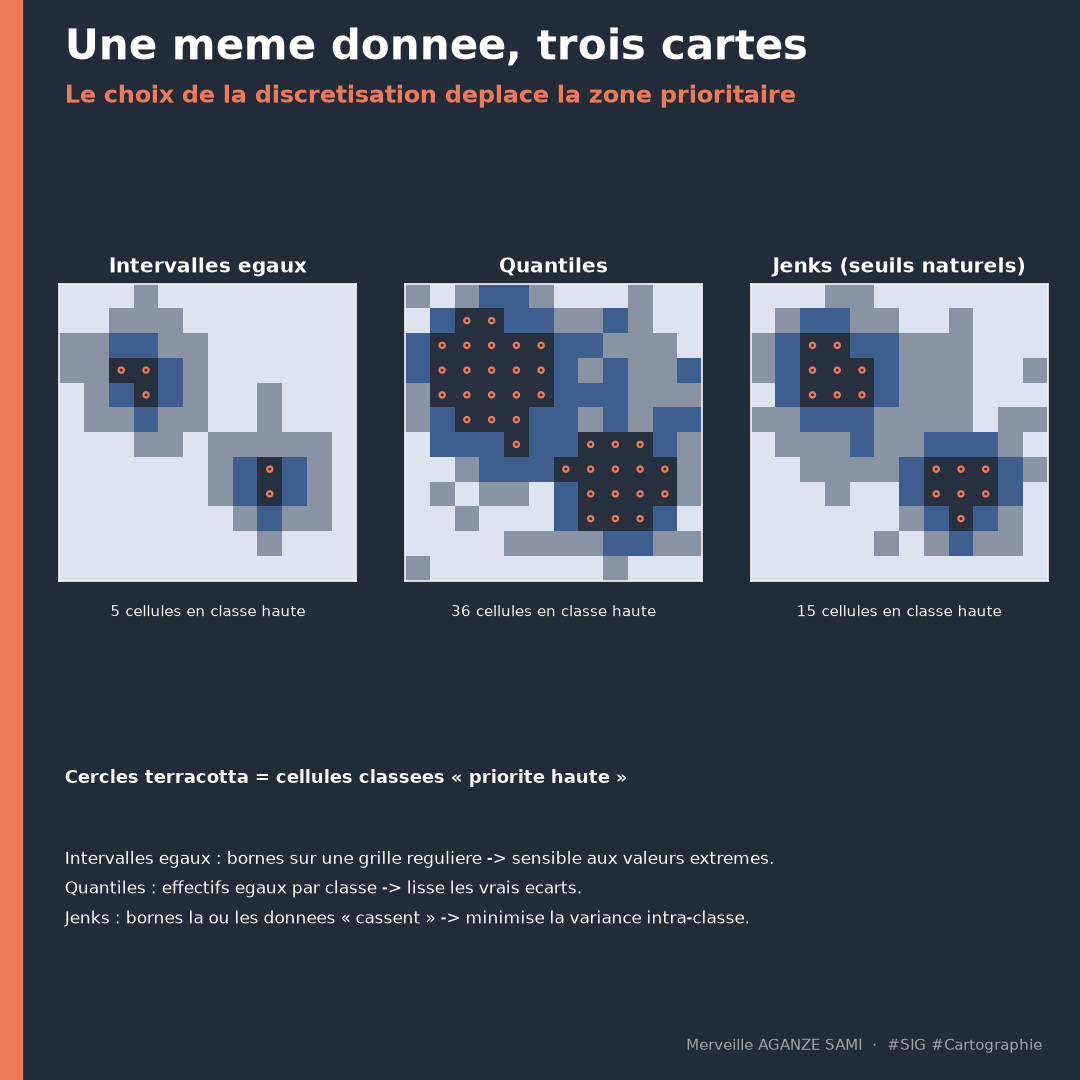
A choropleth map is frequently perceived as a neutral rendering of data. Yet it rests on a methodological decision taken upstream of any graphic choice: how continuous values are grouped into classes. This operation, known as classification, largely determines the message the map conveys.
The exercise is easy to reproduce. Classifying the same indicator, on the same base map and with the same colour ramp, successively by equal intervals, quantiles and natural breaks yields three representations whose hierarchies differ. A unit placed in the top category under one method may fall into the middle category under another. The reader generally has access to none of this information.
1. Three families of methods, three rationales
The most widely used classification methods serve distinct objectives, which explains why none is universally preferable (Slocum et al., 2022).
- Equal intervals. The value range is divided into classes of identical width. The method is easy to explain and preserves the original metric, but produces very unevenly populated classes where the distribution is skewed — a frequent case for socio-economic indicators.
- Quantiles. Each class receives an identical number of units. The map is visually balanced and lends itself to rank comparison, but breaks may separate near-identical values or group widely differing ones.
- Natural breaks (Jenks). The method seeks the partition minimising within-class variance and maximising between-class variance. It places boundaries at the actual discontinuities of the distribution (Jenks, 1967).
- Standard deviations. Breaks are defined relative to the mean. This approach suits symmetric distributions and highlights departures from the norm rather than absolute levels.
The algorithm underlying natural breaks corresponds to the optimal one-dimensional partitioning formalised by Fisher, whose cartographic application Jenks proposed (Fisher, 1958). Its goodness of fit can be quantified by the fraction of variance explained by the partition, allowing objective comparison across numbers of classes.
2. What the choice actually changes
The effect of classification is not merely aesthetic. It bears on three dimensions of a map's use.
Prioritisation first: where a map serves to designate intervention areas, moving from one method to another shifts the boundary between categories and therefore alters the list of selected units. Comparability next: two maps produced at different dates with recalculated breaks are not comparable, since the same colour no longer covers the same values. Perception finally: work on map reading shows that the number of classes and hue contrast influence readers' estimation of values (Brewer & Pickle, 2002).
The particular case of rates. Mapping raw counts as a choropleth induces erroneous reading, as unit area is conflated with the intensity of the phenomenon. Values must be normalised — by population, area or another reference quantity — before any classification.
3. A reporting rule
The main difficulty is not choosing a method, but leaving that choice implicit. A map intended for a decision or a report should state, in its legend or methodological note, four elements: the classification method used, the number of classes, the effective breaks, and the normalising variable where a rate is involved.
This documentation offers two practical advantages. It makes the map reproducible, and therefore verifiable. And it prepares the answer to the question a partner or donor eventually asks: on what basis was this threshold set?
4. Usage recommendations
- For a time series or a comparison across territories, fix the breaks once and retain them, even at the cost of some detail on any individual map.
- For exploration of a new dataset, natural breaks efficiently reveal the structure of the distribution.
- For a rank map or relative prioritisation, quantiles remain legible and easy to justify.
- Limit the number of classes to five or seven: beyond that, visual discrimination of hues becomes unreliable.
- Systematically examine the variable's histogram before choosing: the shape of the distribution guides the choice better than any general rule.
Key points
- Classification is a methodological decision, taken before any graphic choice
- Equal intervals, quantiles and natural breaks serve different objectives
- The method chosen alters which areas are classified as priorities
- Breaks recalculated at each edition make maps non-comparable over time
- Method, number of classes, breaks and normalisation must appear in the reporting
A map does not distort data. But class breaks, when left implicit, shape the reading without the reader being able to judge them.
References
- Brewer, C. A., & Pickle, L. (2002). Evaluation of Methods for Classifying Epidemiological Data on Choropleth Maps in Series. Annals of the Association of American Geographers, 92(4), 662–681. doi.org/10.1111/1467-8306.00310
- Fisher, W. D. (1958). On Grouping for Maximum Homogeneity. Journal of the American Statistical Association, 53(284), 789–798. doi.org/10.1080/01621459.1958.10501479
- Jenks, G. F. (1967). The Data Model Concept in Statistical Mapping. International Yearbook of Cartography, 7, 186–190.
- Slocum, T. A., McMaster, R. B., Kessler, F. C., & Howard, H. H. (2022). Thematic Cartography and Geovisualization (4th ed.). Boca Raton: CRC Press. doi.org/10.1201/9781003150527

Merveille Aganze Sami
MEL & Database Management Advisor. 9+ years of experience in monitoring & evaluation, GIS and digitalization with international organizations (GIZ, Enabel) in DR Congo.
Prioritisation maps to make defensible?
Get in touch