A logframe organises measurement around a theory of change formulated before implementation. The indicators it contains answer a precise question: did what was planned occur, and to what extent? This construction serves its purpose, but it carries a structural limitation — it can only measure what was anticipated at design stage.
Unplanned effects, favourable or otherwise, therefore escape the system. A project may report indicators on target while producing transformations no one has documented, or generating side effects no line of the framework flags. The most significant change technique addresses precisely this blind spot.
1. The principle of the method
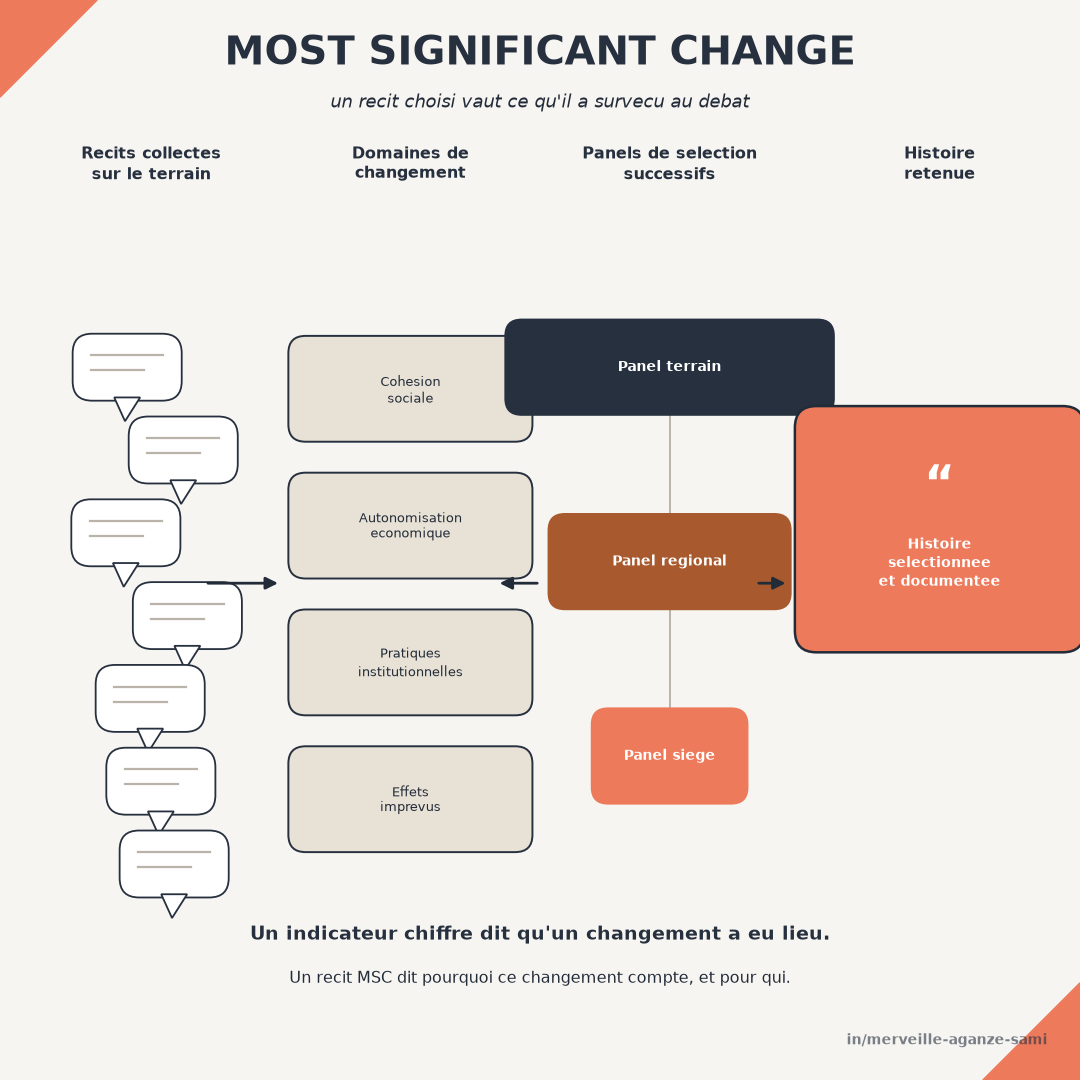
The technique rests on collecting change stories formulated by the people concerned, with no predetermined response grid. These stories then travel upward through successive bodies — field team, regional coordination, management — each of which selects, through deliberation, the story or stories it judges most significant, recording in writing the reasons for its choice (Dart & Davies, 2003).
What is really being selected. The outcome of the process is not a representative sample of changes, and does not claim to be. What the method produces is an explicit record of the value criteria applied at each level of the organisation: what some regard as an important change, and what others retain. Discussing these divergences constitutes a substantial part of the contribution, on a par with the stories themselves (Davies & Dart, 2005).
2. Implementation in four stages
- 1Define domains of change and periodicity. Domains stay deliberately broad — changes in practices, relationships, living conditions — so as not to reproduce the structure of the logframe. Periodicity, generally quarterly or half-yearly, must remain sustainable over time.
- 2Collect the stories. The question is open: in your view, what was the most important change during the period, and why do you consider it important? The second half of the question carries the analytical information.
- 3Run the selection panels. Each level examines the stories transmitted, selects, and — this is non-negotiable — documents its reasons. Without that written trace, the method loses its analytical value and reduces to a collection of anecdotes.
- 4Report back and verify. Selected stories are returned to the communities concerned, and a sample undergoes factual verification. This two-part step conditions the credibility of the whole.
3. What the method adds to a quantitative system
The contribution operates on three distinct levels. Unanticipated effects — including adverse ones — become visible, whereas no predefined indicator could flag them. The criteria by which the people concerned judge a change important are documented, shifting the definition of a result beyond the donor's reporting form alone. And the stories provide material on mechanisms: they indicate how a change came about, information an aggregate figure does not contain.
This last property makes the method complementary to theory-based evaluation approaches, which seek to establish the plausibility of a contribution by examining the causal chain rather than by statistically isolating an effect (Mayne, 2012). Stories feed directly into the examination of assumed mechanisms and, where relevant, expose their failures.
4. Rigour conditions
- No representativeness. Selection is deliberative, not probabilistic. Selected stories support no inference about the frequency of a phenomenon and must never be presented as if they did. Their function is to document the existence and nature of a change, not its magnitude.
- Positive bias. People interviewed by a project team tend to report favourable changes. The question must explicitly invite mention of adverse developments, and panels should be required to retain such a story periodically.
- Facilitation quality. The method is sensitive to how stories are collected. A leading question or a rephrasing by the interviewer transforms the material. Training those responsible for collection is a prerequisite, not an option.
- Implementation burden. Panels, minutes, feedback sessions and verification represent a real coordination cost. Partial implementation — collection without panels, or panels without documented reasons — produces material of little use (Willetts & Crawford, 2007).
- Traceability of the analysis. The usual quality criteria for qualitative research — traceability of decisions, confirmability, feedback to those concerned — apply in full (Lincoln & Guba, 1985). A written protocol specifying domains, panel composition and recording arrangements must accompany the process.
5. Articulation with the logframe
The technique does not replace the quantitative system; it covers its blind spot. A simple articulation is to keep the logframe for reporting on what was planned, and to use stories to document what was not, treating both sources within a single analytical exercise rather than in two separate annexes.
Uses documented in recent literature confirm that the method's value depends heavily on the quality of the protocol adopted and on the consistency of its implementation over time (Sharma et al., 2024). A one-off application at project close markedly reduces its scope.
Key points
- The logframe measures only what was anticipated at design stage
- The method collects open stories and has them selected by successive panels
- Written documentation of selection reasons carries most of the analytical value
- Stories are not representative: they document the existence of a change, not its frequency
- Positive bias must be addressed explicitly in question wording and panel instructions
An indicator establishes that a change occurred and to what extent. A selected and argued story indicates why that change matters, to whom, and by what criteria. Both are needed for a complete reading of results.
References
- Dart, J., & Davies, R. (2003). A Dialogical, Story-Based Evaluation Tool: The Most Significant Change Technique. American Journal of Evaluation, 24(2), 137–155. doi.org/10.1177/109821400302400202
- Davies, R., & Dart, J. (2005). The « Most Significant Change » (MSC) Technique: A Guide to Its Use. CARE International, Oxfam Community Aid Abroad et al.
- Lincoln, Y. S., & Guba, E. G. (1985). Naturalistic Inquiry. Beverly Hills: Sage Publications.
- Mayne, J. (2012). Contribution analysis: Coming of age? Evaluation, 18(3), 270–280. doi.org/10.1177/1356389012451663
- Sharma, M. K., Khanal, S. P., & van Teijlingen, E. (2024). Most Significant Change Approach: A Guide to Assess the Programmatic Effects. International Journal of Qualitative Methods, 23. doi.org/10.1177/16094069241272143
- Willetts, J., & Crawford, P. (2007). The most significant lessons about the Most Significant Change technique. Development in Practice, 17(3), 367–379. doi.org/10.1080/09614520701336907

Merveille Aganze Sami
MEL & Database Management Advisor. 9+ years of experience in monitoring & evaluation, GIS and digitalization with international organizations (GIZ, Enabel) in DR Congo.
A monitoring system to complement with qualitative work?
Get in touch