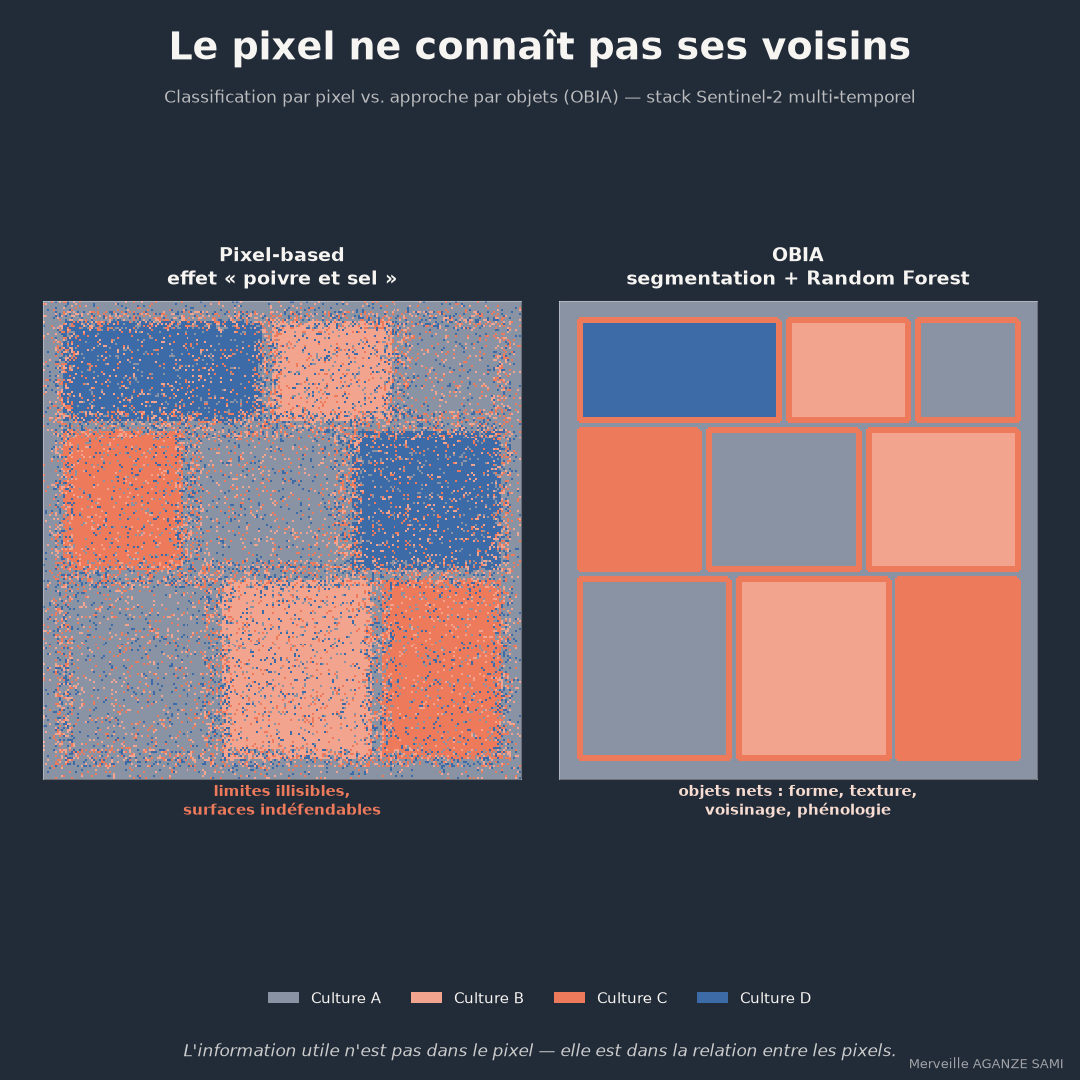
Classifying a satellite image means assigning a land-cover class to each spatial unit. Where that unit is the pixel, every cell is treated independently of its neighbours, on the basis of its spectral signature alone. This independence assumption does not match the actual organisation of the landscape, where objects — fields, water bodies, built-up blocks — consist of sets of contiguous pixels.
The consequence is visible on the resulting maps: homogeneous areas scattered with isolated misclassified pixels, a phenomenon commonly known as the salt-and-pepper effect, and irregular entity boundaries. Beyond appearance, these artefacts directly affect measurement: an area computed from a noisy classification cannot be defended as an indicator.
1. Reversing the order of operations
Object-based analysis inverts the sequence. The image is first segmented into internally homogeneous regions, then each region is classified as an entity. This approach emerged as a distinct methodological framework as sensor resolution became fine relative to the size of the objects of interest — a situation in which a pixel no longer represents an entity but a fraction of one (Blaschke, 2010).
What an object carries that a pixel cannot. A segmented region has attributes an isolated cell cannot have: area, perimeter, compactness, elongation, texture statistics, spectral mean and standard deviation across all its pixels, neighbourhood relations, and — on an image stack — a complete temporal trajectory. These descriptors substantially widen the variable space available for classification.
2. The segmentation scale parameter
Segmentation groups pixels according to a criterion combining spectral homogeneity and shape regularity, subject to a scale parameter that determines the average size of the objects produced. This parameter is the central methodological decision of the approach.
Too low a value fragments real entities into multiple objects, reproducing part of the initial problem. Too high a value merges distinct entities, producing mixed objects whose classification is necessarily approximate. Automatic estimation methods for this parameter, based on the analysis of local variance as a function of scale, allow the choice to be grounded rather than reached by trial and error (Drăguț et al., 2014).
In practice, working at several scale levels simultaneously is common, each level corresponding to a category of objects of interest: fields at a fine scale, landscape units at a broader one.
3. Classifying the objects
Classifying segmented objects commonly draws on supervised learning methods. Random forests, which aggregate a large number of decision trees built on random subsets of observations and variables (Breiman, 2001), are particularly well suited here: they handle a high number of potentially correlated variables, require no distributional assumption, and provide a variable-importance measure useful for interpretation (Belgiu & Drăguț, 2016).
The decisive contribution comes from the temporal dimension. Two crops with similar spectral signatures on a given date often differ in their development calendar. An image stack covering the season lets the classification exploit this phenological difference, which no single image provides. Reviews of supervised object-based classification document the contribution of such multi-temporal variables (Ma et al., 2017).
4. What the approach does not remove the need for
- Segmentation does not fix training data. An unbalanced or poorly located sample set produces an erroneous classification regardless of object quality. Building ground reference data remains decisive.
- Segmentation errors propagate. A mixed object containing two distinct land covers will be assigned to a single class. Such errors cannot be recovered downstream and must be identified at the segmentation stage.
- A classified area is not an estimated area. Counting the pixels or objects of a class yields a biased estimate as soon as the classification contains errors. Established good practice recommends area estimation based on a probability validation sample, with a confidence interval (Olofsson et al., 2014).
- Parameterisation must be versioned. Scale parameter, shape criteria, selected variables and training set define the result. Without traceability, two successive exercises are not comparable.
5. What this changes for an indicator
Three concrete differences distinguish an object-based map from a pixel-based classification, from a programme monitoring standpoint. Entity boundaries are continuous, making objects superimposable on a field cadastre and verifiable during a visit. Measured areas correspond to identifiable entities rather than aggregates of cells. And each object can carry additional attributes — classification date, confidence level, index trajectory — that feed directly into a monitoring database.
These properties make the indicator discussable with a partner: one can point to an entity, question its class, verify it on the ground. It is this possibility of contradiction that grounds the credibility of an imagery-derived measurement.
Key points
- Pixel-based classification ignores the relationship between neighbours and produces noisy boundaries
- Segmentation endows each object with shape, texture and neighbourhood attributes
- The scale parameter is the central decision; methods exist to ground it
- The temporal dimension separates spectrally similar classes through their phenology
- A classified area must be converted into an estimated area with a confidence interval
The information useful for monitoring is not contained in the value of an isolated pixel, but in the spatial and temporal organisation of the whole. Classifying entities rather than cells aligns the analytical method with the structure of the object observed.
References
- Belgiu, M., & Drăguț, L. (2016). Random forest in remote sensing: A review of applications and future directions. ISPRS Journal of Photogrammetry and Remote Sensing, 114, 24–31. doi.org/10.1016/j.isprsjprs.2016.01.011
- Blaschke, T. (2010). Object based image analysis for remote sensing. ISPRS Journal of Photogrammetry and Remote Sensing, 65(1), 2–16. doi.org/10.1016/j.isprsjprs.2009.06.004
- Breiman, L. (2001). Random Forests. Machine Learning, 45(1), 5–32. doi.org/10.1023/A:1010933404324
- Drăguț, L., Csillik, O., Eisank, C., & Tiede, D. (2014). Automated parameterisation for multi-scale image segmentation on multiple layers. ISPRS Journal of Photogrammetry and Remote Sensing, 88, 119–127. doi.org/10.1016/j.isprsjprs.2013.11.018
- Ma, L., Li, M., Ma, X., Cheng, L., Du, P., & Liu, Y. (2017). A review of supervised object-based land-cover image classification. ISPRS Journal of Photogrammetry and Remote Sensing, 130, 277–293. doi.org/10.1016/j.isprsjprs.2017.06.001
- Olofsson, P., Foody, G. M., Herold, M., Stehman, S. V., Woodcock, C. E., & Wulder, M. A. (2014). Good practices for estimating area and assessing accuracy of land change. Remote Sensing of Environment, 148, 42–57. doi.org/10.1016/j.rse.2014.02.015

Merveille Aganze Sami
MEL & Database Management Advisor. 9+ years of experience in monitoring & evaluation, GIS and digitalization with international organizations (GIZ, Enabel) in DR Congo.
Satellite-based agricultural monitoring to structure?
Get in touch