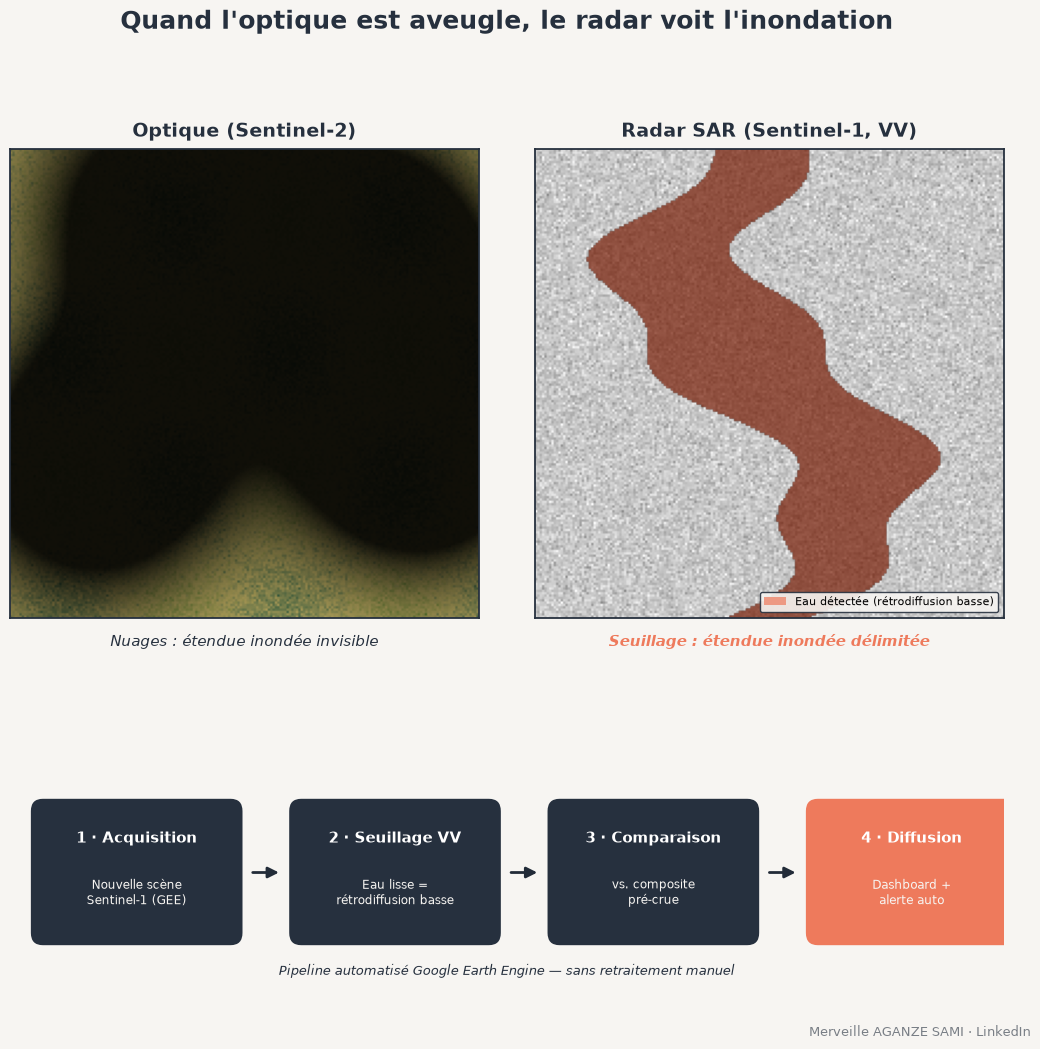
Flood monitoring in Central Africa faces a structural constraint: the period of highest exposure to risk coincides with the one in which optical satellite imagery is least available. During the rainy season, cloud cover over the Congo Basin severely limits the acquisition of usable optical observations — a difficulty well documented for forest monitoring in the region (Reiche et al., 2021) and for observation of tropical environments more broadly (Langhorst & Pavelsky, 2024).
Radar imagery offers a robust alternative to this limitation. This article outlines the physical principles on which it rests, a reproducible processing chain based on Sentinel-1 data, and — a frequently under-documented aspect — the sources of error that should be anticipated before any operational use.
1. Physical basis: cloud transparency in C-band
An optical sensor is a passive system: it measures solar radiation reflected by the Earth's surface. Any intervening cloud layer therefore becomes the object being measured, making ground observation impossible.
A Synthetic Aperture Radar (SAR), by contrast, is an active system: it emits its own microwave radiation and measures the energy backscattered by the surface. The Copernicus Sentinel-1 mission operates in C-band, at a wavelength of approximately 5.6 cm (Torres et al., 2012). Since cloud droplets are several orders of magnitude smaller than this wavelength, their interaction with the signal remains negligible: at this scale, the cloudy atmosphere is effectively transparent.
Operational consequence. Active emission also removes dependence on solar illumination. The two principal constraints of optical imagery — cloudiness and the day/night cycle — are thus lifted, ensuring observation regularity independent of weather conditions.
2. Radar signature of water surfaces
Detection of flooded surfaces relies on a well-established property: at the scale of the wavelength, a calm water body behaves as a specular surface. The incident signal is reflected predominantly away from the sensor, so that the measured backscattered energy is low. Open water consequently appears dark in the image, in marked contrast with vegetation, rough soils and built-up surfaces, whose scattering is higher.
This contrast can be quantified: in C-band, the backscatter coefficient of open water surfaces generally falls between −15 and −20 dB, a range widely reported in the literature and used in automated chains (Twele et al., 2016). This separability explains why histogram thresholding is, in many contexts, sufficient to extract water — threshold-based approaches remaining among the most widely used for SAR flood mapping (Landuyt et al., 2019).
The choice of polarisation warrants attention. Sentinel-1 most often acquires in dual polarisation, VV and VH. For open-water detection, VV polarisation is generally preferred owing to its better water/non-water contrast. VH polarisation, more sensitive to volume scattering within the canopy, is of complementary interest when the objective is to detect flooding beneath vegetation — a considerably more complex configuration (Tsyganskaya et al., 2018).
3. A five-step processing chain
Operational value lies less in producing a single map than in the capacity to regenerate that map at each satellite revisit, without manual intervention. The Google Earth Engine platform, which provides the pre-processed Sentinel-1 archive and executes computation server-side (Gorelick et al., 2017), lends itself well to this automation.
- 1Establish a permanent-water reference. A median composite of dry-season images characterises the baseline hydrological state. The JRC Global Surface Water dataset, derived from thirty-two years of Landsat archives, offers a robust alternative or complement for distinguishing permanent from seasonal water (Pekel et al., 2016).
- 2Reduce speckle. Speckle is a multiplicative noise inherent to coherent imaging. Its attenuation through adaptive filtering, for which the Lee filter is the historical reference (Lee, 1980), or through multi-temporal averaging, conditions the quality of subsequent thresholding.
- 3Determine the separation threshold. A fixed threshold shows limited stability from scene to scene. Otsu's method, which identifies the threshold minimising intra-class variance in a bimodal histogram (Otsu, 1979), provides a more reproducible automatic determination. Hierarchical split-based approaches further improve robustness when water occupies a small proportion of the scene (Chini et al., 2017).
- 4Isolate new water. The difference between detected water and the permanent reference delineates the flood extent proper, the only quantity relevant to an alert system.
- 5Cross-reference and disseminate. Intersection with exposure layers — settlements, infrastructure, plots, intervention areas — converts an area into decision-relevant information. Crossing an area threshold can then trigger an automated alert.
Sentinel-1 revisit frequency is of the order of six to twelve days depending on latitude and constellation configuration. This does not constitute real time, but provides a regularity that optical imagery cannot guarantee in humid tropical settings. The data are distributed free of charge under an open licence.
4. Limitations and sources of error
The operational reliability of a detection chain depends directly on explicit treatment of its limitations. The main ones are documented and concern both false negatives and false positives (Landuyt et al., 2019).
- Wind-induced roughness. A choppy water surface loses its specular behaviour and backscatters more signal, raising its value above the detection threshold. This results in underestimation of flood extent during windy episodes.
- Confusion with smooth dry surfaces. Very flat bare soils, sandy surfaces and bituminous pavements also exhibit low backscatter and may be wrongly classified as water surfaces.
- Flooding beneath vegetation or in urban areas. Under canopy or between buildings, the double-bounce mechanism between the water surface and vertical structures increases backscatter rather than reducing it. Flooding then appears in high values, which invalidates simple thresholding and calls for dedicated approaches (Tsyganskaya et al., 2018).
- Geometric terrain effects. In rugged terrain, radar shadow and layover generate low-signal areas liable to be confused with water.
The principal corrective lever is topographic. Integrating a digital elevation model, and more specifically the Height Above Nearest Drainage (HAND) index, allows detections located on steep slopes or well above the drainage network to be discarded (Nobre et al., 2011). This topographic and hydrological contextualisation appreciably reduces the false-positive rate and is now part of good practice in operational chains.
5. Operational significance
For a project team, the benefit is measured in decision latency. Having a flood extent estimate within days of the event, rather than within weeks, changes the nature of the questions that can be answered: affected settlements, interrupted transport routes, submerged agricultural plots, prioritisation of verification missions.
The contribution is also methodological. A dated, reproducible and documented estimate — method, threshold, source, uncertainty — constitutes a stronger accountability record than a qualitative assessment reconstructed after the fact. Automating the chain further ensures comparability between successive events.
Key points
- C-band (≈ 5.6 cm) penetrates cloud cover and is independent of solar illumination
- Open water exhibits low backscatter, generally between −15 and −20 dB in VV polarisation
- A permanent-water reference is required to isolate the flood extent
- Wind, smooth dry surfaces, vegetation cover and terrain are the four principal sources of error
- Topographic contextualisation (DEM, HAND) significantly reduces false positives
6. Implementation: first steps
Sentinel-1 data are accessible through the Copernicus Data Space Ecosystem and available in pre-processed form in the Google Earth Engine catalogue. An effective learning approach consists in reconstructing the extent of a past, well-documented flood in one's own territory, then comparing the result with available field observations. This comparison allows context-specific omission and commission rates to be estimated, and constitutes a reasonable prerequisite to any operational use.
The value of an observation dataset depends less on its resolution or visual rendering than on its availability at the moment a decision must be taken. In humid tropical settings, that availability is precisely what radar imagery provides.
References
- Chini, M., Hostache, R., Giustarini, L., & Matgen, P. (2017). A Hierarchical Split-Based Approach for Parametric Thresholding of SAR Images: Flood Inundation as a Test Case. IEEE Transactions on Geoscience and Remote Sensing, 55(12), 6975–6988. doi.org/10.1109/TGRS.2017.2737664
- Gorelick, N., Hancher, M., Dixon, M., Ilyushchenko, S., Thau, D., & Moore, R. (2017). Google Earth Engine: Planetary-scale geospatial analysis for everyone. Remote Sensing of Environment, 202, 18–27. doi.org/10.1016/j.rse.2017.06.031
- Landuyt, L., Van Wesemael, A., Schumann, G. J.-P., Hostache, R., Verhoest, N. E. C., & Van Coillie, F. M. B. (2019). Flood Mapping Based on Synthetic Aperture Radar: An Assessment of Established Approaches. IEEE Transactions on Geoscience and Remote Sensing, 57(2), 722–739. doi.org/10.1109/TGRS.2018.2860054
- Langhorst, T., & Pavelsky, T. (2024). Global Cloud Biases in Optical Satellite Remote Sensing of Rivers. Geophysical Research Letters, 51(15). doi.org/10.1029/2024GL110085
- Lee, J.-S. (1980). Digital Image Enhancement and Noise Filtering by Use of Local Statistics. IEEE Transactions on Pattern Analysis and Machine Intelligence, PAMI-2(2), 165–168. doi.org/10.1109/TPAMI.1980.4766994
- Nobre, A. D., Cuartas, L. A., Hodnett, M., Rennó, C. D., Rodrigues, G., Silveira, A., Waterloo, M., & Saleska, S. (2011). Height Above the Nearest Drainage – a hydrologically relevant new terrain model. Journal of Hydrology, 404(1–2), 13–29. doi.org/10.1016/j.jhydrol.2011.03.051
- Otsu, N. (1979). A Threshold Selection Method from Gray-Level Histograms. IEEE Transactions on Systems, Man, and Cybernetics, 9(1), 62–66. doi.org/10.1109/TSMC.1979.4310076
- Pekel, J.-F., Cottam, A., Gorelick, N., & Belward, A. S. (2016). High-resolution mapping of global surface water and its long-term changes. Nature, 540, 418–422. doi.org/10.1038/nature20584
- Reiche, J., Mullissa, A., Slagter, B., Gou, Y., Tsendbazar, N.-E., Odongo-Braun, C., Vollrath, A., Weisse, M. J., Stolle, F., Pickens, A., Donchyts, G., Clinton, N., Gorelick, N., & Herold, M. (2021). Forest disturbance alerts for the Congo Basin using Sentinel-1. Environmental Research Letters, 16(2), 024005. doi.org/10.1088/1748-9326/abd0a8
- Torres, R., Snoeij, P., Geudtner, D., Bibby, D., Davidson, M., Attema, E., et al. (2012). GMES Sentinel-1 mission. Remote Sensing of Environment, 120, 9–24. doi.org/10.1016/j.rse.2011.05.028
- Tsyganskaya, V., Martinis, S., Marzahn, P., & Ludwig, R. (2018). SAR-based detection of flooded vegetation – a review of characteristics and approaches. International Journal of Remote Sensing, 39(8), 2255–2293. doi.org/10.1080/01431161.2017.1420938
- Twele, A., Cao, W., Plank, S., & Martinis, S. (2016). Sentinel-1-based flood mapping: a fully automated processing chain. International Journal of Remote Sensing, 37(13), 2990–3004. doi.org/10.1080/01431161.2016.1192304

Merveille Aganze Sami
MEL & Database Management Advisor. 9+ years of experience in monitoring & evaluation, GIS and digitalization with international organizations (GIZ, Enabel) in DR Congo.
Environmental monitoring to strengthen through satellite observation?
Get in touch