Most development programmes allocate their benefits according to explicit rules: a cultivated area below a given number of hectares, a vulnerability score under a threshold, an income beneath a ceiling. These administrative rules, designed for management reasons, constitute a methodological resource that often goes unused in impact evaluation.
Direct comparison between beneficiaries and non-beneficiaries remains exposed to selection bias: the two groups generally differ from the outset, and the observed gap mixes the programme effect with these initial differences. Regression discontinuity, introduced in educational psychology by Thistlethwaite and Campbell, offers a solution resting entirely on the assignment rule (Thistlethwaite & Campbell, 1960).
1. The principle: a quasi-experiment near the threshold
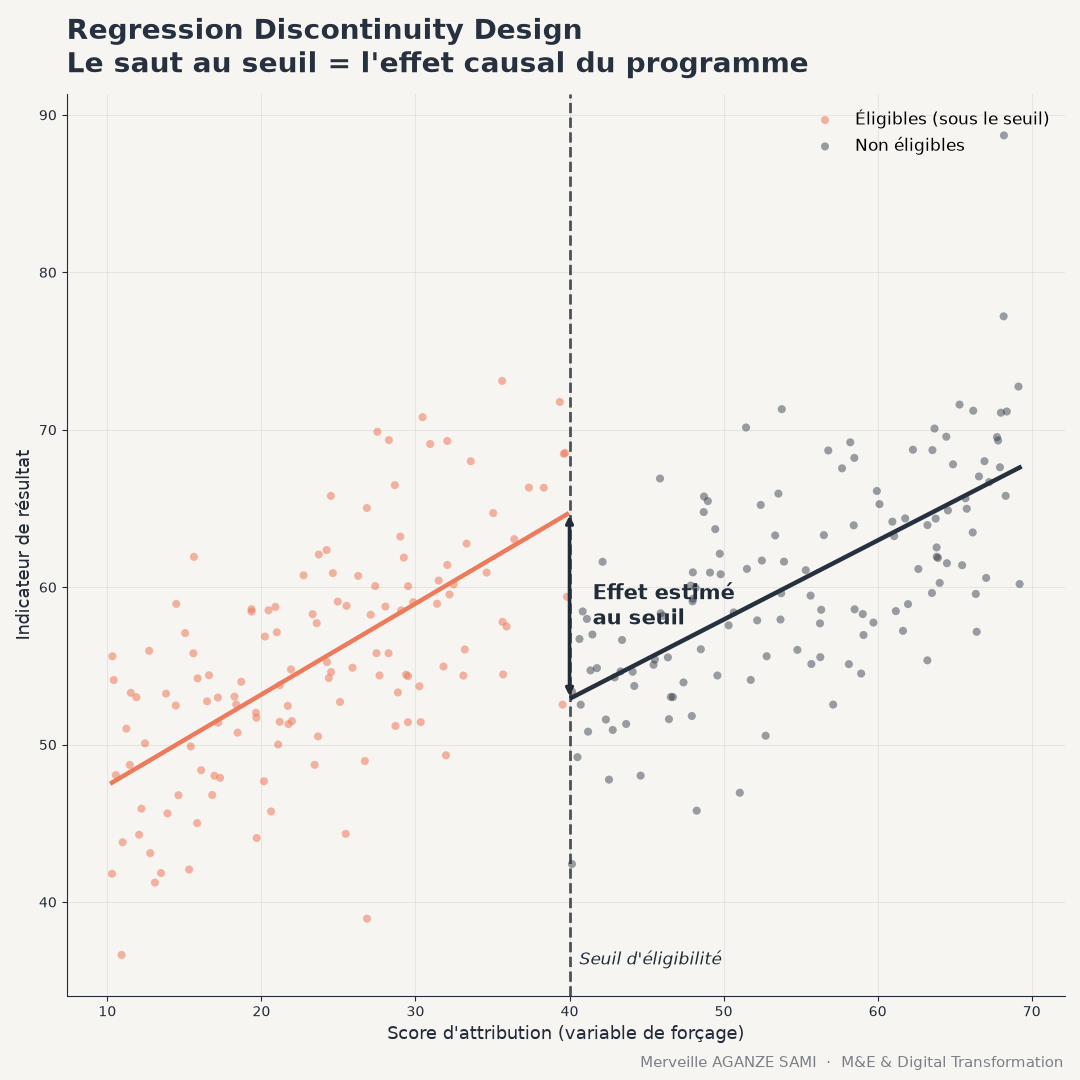
The core argument is as follows. Consider two households whose vulnerability scores are 39 and 41 respectively, for an eligibility threshold set at 40. Across observable and unobservable characteristics alike, these two households are likely very similar: a difference of one or two points largely reflects measurement or chance. Yet one benefits from the programme and the other does not.
In the immediate vicinity of the threshold, treatment assignment therefore approximates a random draw. It becomes possible to estimate the programme effect as the discontinuity — the jump — in the outcome indicator at the cutoff, once the continuous relationship between that indicator and the running variable is accounted for (Imbens & Lemieux, 2008).
Two variants. Where crossing the threshold strictly determines access to the programme, the design is termed sharp RDD. Where it merely alters the probability of access — targeting applied with exceptions — fuzzy RDD applies, estimated through instrumental variables.
2. Validity conditions
The credibility of the estimate rests on testable assumptions, the most important being the absence of manipulation of the running variable.
- No manipulation. If households or agents can adjust the reported score to cross the threshold, local comparability disappears. The McCrary test examines the continuity of the running variable's density near the cutoff: an abnormal accumulation of observations just below or just above is a warning signal (McCrary, 2008).
- Continuity of covariates. Characteristics observed before the intervention should exhibit no jump at the threshold. A test applied to each of them, using the same specification as for the outcome, verifies this.
- No competing threshold. If another policy uses the same cutoff value, the estimated effect aggregates both schemes and cannot be attributed to the programme under study.
- Sufficient numbers near the cutoff. Estimation draws only on observations close to the threshold. A large overall sample does not guarantee sufficient local statistical power.
3. Estimation choices
Two technical decisions strongly influence the result and must be justified.
The bandwidth determines which observations enter the analysis. A narrow bandwidth improves comparability but reduces precision; a wide one has the opposite effect. Automatic selection procedures based on a mean squared error criterion provide a documented starting point (Calonico et al., 2014).
The functional form next. Current practice favours low-order local polynomial fits — linear or quadratic — estimated separately on each side of the threshold. High-order polynomials are discouraged: they produce unstable estimates and misleading confidence intervals at the boundaries of the interval (Gelman & Imbens, 2019).
4. Robustness tests
Three checks complement the main analysis. Shifting the threshold to placebo values, where no effect is expected, should reveal no significant discontinuity. Varying the bandwidth should produce results stable in order of magnitude. Excluding observations closest to the threshold finally allows testing sensitivity to any residual manipulation.
5. Scope and limitation
The effect estimated by RDD is local to the vicinity of the threshold. It informs what the programme would have produced for units at the margin of eligibility — often relevant information when adjusting a targeting criterion, but not extrapolable to beneficiaries far from the cutoff.
This restriction is at once the strength and the limitation of the method. Rigorous causal identification is paid for with reduced scope. Any reporting should therefore state explicitly that the conclusion holds near the cutoff and not for the beneficiary population as a whole (Lee & Lemieux, 2010).
Key points
- An administrative eligibility threshold creates a quasi-experiment in its vicinity
- The effect reads as the discontinuity in the outcome at the cutoff
- The McCrary test verifies the absence of manipulation of the running variable
- Favour low-order local polynomials; avoid high orders
- The estimated effect is local: it does not extrapolate to units far from the threshold
References
- Calonico, S., Cattaneo, M. D., & Titiunik, R. (2014). Robust Nonparametric Confidence Intervals for Regression-Discontinuity Designs. Econometrica, 82(6), 2295–2326. doi.org/10.3982/ECTA11757
- Gelman, A., & Imbens, G. (2019). Why High-Order Polynomials Should Not Be Used in Regression Discontinuity Designs. Journal of Business & Economic Statistics, 37(3), 447–456. doi.org/10.1080/07350015.2017.1366909
- Imbens, G. W., & Lemieux, T. (2008). Regression discontinuity designs: A guide to practice. Journal of Econometrics, 142(2), 615–635. doi.org/10.1016/j.jeconom.2007.05.001
- Lee, D. S., & Lemieux, T. (2010). Regression Discontinuity Designs in Economics. Journal of Economic Literature, 48(2), 281–355. doi.org/10.1257/jel.48.2.281
- McCrary, J. (2008). Manipulation of the running variable in the regression discontinuity design: A density test. Journal of Econometrics, 142(2), 698–714. doi.org/10.1016/j.jeconom.2007.05.005
- Thistlethwaite, D. L., & Campbell, D. T. (1960). Regression-discontinuity analysis: An alternative to the ex post facto experiment. Journal of Educational Psychology, 51(6), 309–317. doi.org/10.1037/h0044319

Merveille Aganze Sami
MEL & Database Management Advisor. 9+ years of experience in monitoring & evaluation, GIS and digitalization with international organizations (GIZ, Enabel) in DR Congo.
An impact evaluation to design without randomisation?
Get in touch