Environmental monitoring of intervention areas frequently rests on a one-off exercise: when a report is due, an analyst downloads a few images, computes an index and produces a map. Between exercises, developments — forest cover loss, retreat of a water body, catchment degradation — go unobserved.
The limiting factor, however, is not data availability. The Sentinel and Landsat archives are open and continuously updated, with revisits of a few days; the opening of the Landsat archive in 2008 was itself a turning point for multi-temporal analysis (Woodcock et al., 2008). The constraint lies in the manual processing chain separating the image from the decision. Automating that chain changes the nature of the system: from an archive consulted periodically, it becomes a continuous detection mechanism.
1. The principle of server-side processing
Cloud-based geospatial computing platforms, of which Google Earth Engine is the most documented, rest on an inversion of the usual logic: instead of bringing images to the analyst's machine, computation is executed on the infrastructure hosting the archives (Gorelick et al., 2017). Only aggregated results — zonal statistics, time series, final maps — travel across the network.
This architecture removes the two classic bottlenecks in low-connectivity settings: download volume and local computing power. It makes accessible multi-temporal analyses over long series that would be difficult to perform on a workstation.
2. Architecture of a scheduled chain
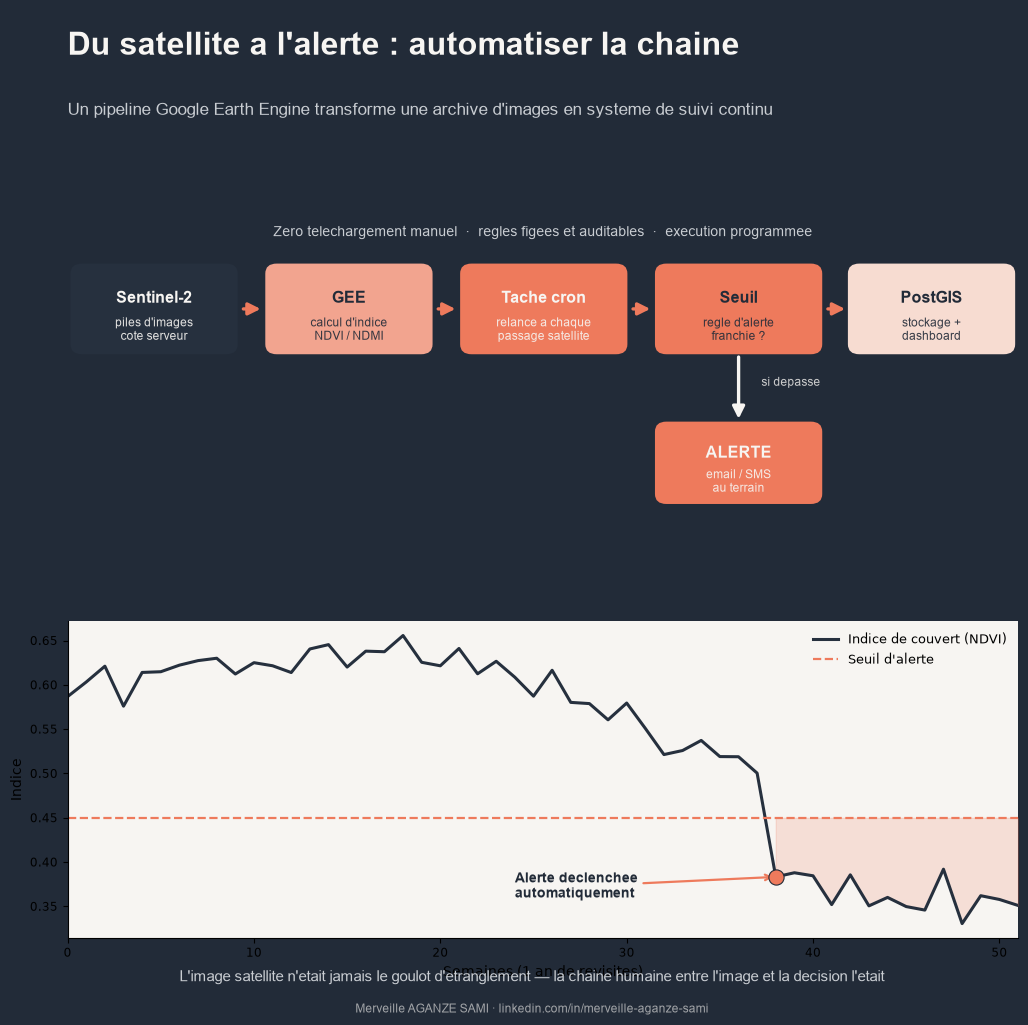
An operational chain is organised around five components.
- 1Definition of extent and filters. Intervention footprints, image collection, time range and maximum cloud cover criterion are fixed once and for all. This stability conditions the comparability of successive measurements.
- 2Pre-processing and masking. Application of cloud and shadow masks using the quality bands supplied with the products, then radiometric harmonisation where several sensors are combined.
- 3Indicator computation. Spectral index, zonal statistic or change detection, depending on the object of monitoring. The computation code is versioned: it is what guarantees that the March and September measurements are commensurable.
- 4Export and persistence. Results are written to a database — PostGIS for spatial data — rather than kept in scattered files. The database becomes the single source feeding all outputs.
- 5Reporting and alerting. A dashboard exposes series and maps; a threshold rule triggers a notification when the indicator crosses a defined value.
On task scheduling. Periodic execution is not provided by the computing platform itself but by an external scheduler — a scheduled task, an automation service or a workflow orchestrator — that invokes the processing at regular intervals. This component, often overlooked at design stage, determines the effective regularity of monitoring.
3. Designing usable alert rules
A threshold applied to a raw value produces a high number of false alerts, since seasonal variability and acquisition noise often exceed the magnitude of the change sought. Three precautions markedly improve the signal-to-noise ratio.
- Compare each observation with a same-season reference rather than with the previous date, so as to neutralise phenology. Continuous change detection approaches use all available acquisitions to model this seasonality before identifying a break (Zhu & Woodcock, 2014).
- Require confirmation across several successive acquisitions before triggering an alert, a principle adopted by operational forest disturbance detection systems (Reiche et al., 2021).
- Define a minimum detection area, consistent with sensor resolution, to exclude variations at the scale of an isolated pixel.
4. Essential quality controls
- Number of valid observations. After cloud masking, a period may contain no usable image. The pipeline must record this, failing which an absence of data is read as an absence of change.
- Series continuity. A change in product version or masking algorithm introduces artificial breaks. Documenting the version of collections used is part of traceability.
- Field validation. An automated alert remains a hypothesis. A verification protocol, however light, must be planned from the design stage, and its feedback used to recalibrate thresholds.
- Logging. Record for each run the date, parameters and number of observations processed: without such a log, an aberrant result cannot be diagnosed after the fact.
5. What automation actually delivers
The gain in frequency is the most visible: quarterly monitoring becomes weekly or ten-daily depending on sensor revisit. The methodological gain matters more still. Fixed, versioned computation rules make successive measurements comparable and the chain auditable — a third party can reproduce the result from the code and parameters.
The displacement of workload finally deserves anticipation. Automation does not remove analytical work; it shifts it from repetitive execution towards design, threshold calibration and alert interpretation. A pipeline with no one to act on its signals produces notifications that nobody handles.
Key points
- Server-side computation removes volume and local processing constraints
- Five components: extent, pre-processing, computation, persistence, reporting
- The external scheduler determines the effective regularity of monitoring
- Seasonal reference, multi-date confirmation and minimum area reduce false alerts
- Record the number of valid observations: absence of data is not absence of change
References
- Gorelick, N., Hancher, M., Dixon, M., Ilyushchenko, S., Thau, D., & Moore, R. (2017). Google Earth Engine: Planetary-scale geospatial analysis for everyone. Remote Sensing of Environment, 202, 18–27. doi.org/10.1016/j.rse.2017.06.031
- Reiche, J., Mullissa, A., Slagter, B., Gou, Y., Tsendbazar, N.-E., Odongo-Braun, C., et al. (2021). Forest disturbance alerts for the Congo Basin using Sentinel-1. Environmental Research Letters, 16(2), 024005. doi.org/10.1088/1748-9326/abd0a8
- Woodcock, C. E., Allen, R., Anderson, M., Belward, A., Bindschadler, R., Cohen, W., et al. (2008). Free Access to Landsat Imagery. Science, 320(5879), 1011. doi.org/10.1126/science.320.5879.1011a
- Zhu, Z., & Woodcock, C. E. (2014). Continuous change detection and classification of land cover using all available Landsat data. Remote Sensing of Environment, 144, 152–171. doi.org/10.1016/j.rse.2014.01.011

Merveille Aganze Sami
MEL & Database Management Advisor. 9+ years of experience in monitoring & evaluation, GIS and digitalization with international organizations (GIZ, Enabel) in DR Congo.
Environmental monitoring to automate?
Get in touch