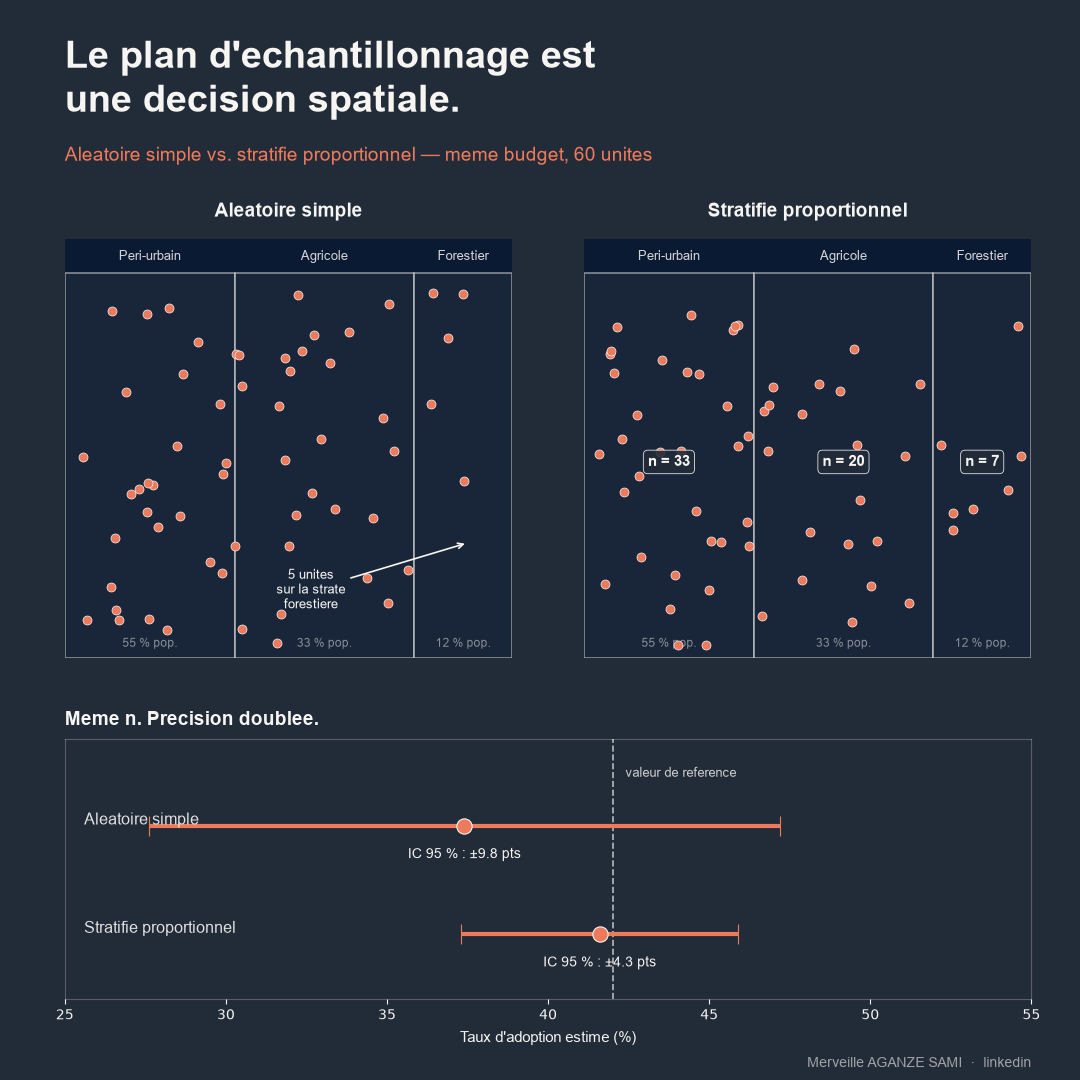
Sampling plans are frequently designed from a list of administrative units and a sample-size calculation. This approach treats the territory as a collection of interchangeable entities. Yet intervention areas most often display a marked spatial structure — ecological gradient, accessibility contrast, density heterogeneity — that bears directly on the variable under study.
Simple random sampling guarantees the absence of bias in expectation, that is, on average across all possible draws. It does not guarantee, for any given draw, balanced coverage of a heterogeneous territory. An area accounting for a minority share of the population may end up with too few units to support a usable estimate at that level.
1. What stratification contributes
Stratification partitions the population into homogeneous subsets and draws independently within each. Its statistical property has long been established: the variance of the stratified estimator depends only on variability within strata, between-strata variability being eliminated by construction (Cochran, 1977).
An operational design criterion follows: strata must be defined according to the factors that genuinely structure the variance of the variable of interest. Stratifying by administrative province contributes nothing if the variable depends on accessibility or agro-ecological zone. The precision gain is proportional to the chosen criterion's ability to separate contrasting situations.
The role of GIS in design. Available geographic layers — land cover, road network, population density, travel time, agro-ecological zoning — provide auxiliary variables usable before collection to build strata. The geographic information system then acts as an instrument for designing the plan, not merely as a tool for mapping results afterwards (Wang et al., 2012).
2. Allocating effort across strata
Once strata are defined, distributing the sample size involves an explicit trade-off between three objectives.
- 1Proportional allocation. Each stratum's sample size is proportional to its share of the population. This is simple, yields uniform weights and suits situations where internal variability is comparable across strata.
- 2Optimal allocation. Sample size is proportional to the product of the stratum weight and its internal standard deviation, minimising overall variance at constant cost. This formulation, established in the founding work on the representative method, requires prior estimates of within-stratum variances (Neyman, 1934).
- 3Allocation with a floor. Where estimates are expected stratum by stratum, a minimum sample size is imposed in each, even at the cost of departing from the global optimum. This favours disaggregation over the precision of the national estimate.
- 4Weighting at analysis. Any non-proportional allocation requires sampling weights when computing estimates. Omitting this step produces biased results.
3. Spatial spread within strata
Stratification does not settle everything: within a stratum, a random draw may concentrate units in one portion of the territory. So-called spatially balanced designs spread units more evenly while preserving known inclusion probabilities, which keeps inference valid (Grafström & Tillé, 2013).
These approaches are particularly useful where the variable has a continuous spatial structure: since two neighbouring units carry partly redundant information, spreading them apart is preferable.
4. The gap between design and actual collection
- Untracked substitutions. Replacing an inaccessible unit with a more convenient one alters the design without the analysis accounting for it. Every substitution must be recorded with its reason.
- Differential nonresponse. Where missing units share a characteristic linked to the variable studied — remoteness, distance from a service — the resulting bias depends not on the nonresponse rate alone but on its correlation with the variable of interest (Groves, 2006).
- Incomplete sampling frame. An outdated list of localities excludes units from the target population at the outset. Cross-checking against land-cover data or recent imagery helps identify the main gaps.
- Cluster effect. Concentrating several units per village reduces costs but also the effective amount of information. This effect must be built into the sample-size calculation rather than discovered at analysis (Kish, 1965).
5. Documenting the design
The value of an estimate depends on the traceability of the design that produced it. Four elements deserve to appear in survey documentation: the stratification criterion and its rationale, the allocation rule adopted, the inclusion probabilities and resulting weights, and the record of actual collection by stratum — units planned, completed, substituted, not reached.
This last point is frequently omitted although it conditions interpretation. A uniform completion rate across strata allows direct reading; a shortfall concentrated in one stratum calls for explicit mention when presenting results.
Key points
- Simple random sampling does not guarantee coverage of a heterogeneous territory on a given draw
- Strata must rest on the factors structuring variance, not on the default administrative division
- Allocation trades overall precision against the ability to disaggregate by stratum
- Any non-proportional allocation requires weighting at analysis
- The collection record by stratum is an integral part of survey documentation
The sample-size calculation determines how many units to observe. Geographic stratification determines which ones. The second decision weighs as much as the first on what the data will support.
References
- Cochran, W. G. (1977). Sampling Techniques (3rd ed.). New York: John Wiley & Sons.
- Grafström, A., & Tillé, Y. (2013). Doubly balanced spatial sampling with spreading and restitution of auxiliary totals. Environmetrics, 24(2), 120–131. doi.org/10.1002/env.2194
- Groves, R. M. (2006). Nonresponse Rates and Nonresponse Bias in Household Surveys. Public Opinion Quarterly, 70(5), 646–675. doi.org/10.1093/poq/nfl033
- Kish, L. (1965). Survey Sampling. New York: John Wiley & Sons.
- Neyman, J. (1934). On the Two Different Aspects of the Representative Method. Journal of the Royal Statistical Society, 97(4), 558–625. doi.org/10.2307/2342192
- Wang, J.-F., Stein, A., Gao, B.-B., & Ge, Y. (2012). A review of spatial sampling. Spatial Statistics, 2, 1–14. doi.org/10.1016/j.spasta.2012.08.001

Merveille Aganze Sami
MEL & Database Management Advisor. 9+ years of experience in monitoring & evaluation, GIS and digitalization with international organizations (GIZ, Enabel) in DR Congo.
A survey design to build?
Get in touch